compute_cdf_percentiles
- grizli.fitting.compute_cdf_percentiles(fit, cdf_sigmas=array([-5., -4.8, -4.6, -4.4, -4.2, -4., -3.8, -3.6, -3.4, -3.2, -3., -2.8, -2.6, -2.4, -2.2, -2., -1.8, -1.6, -1.4, -1.2, -1., -0.8, -0.6, -0.4, -0.2, 0., 0.2, 0.4, 0.6, 0.8, 1., 1.2, 1.4, 1.6, 1.8, 2., 2.2, 2.4, 2.6, 2.8, 3., 3.2, 3.4, 3.6, 3.8, 4., 4.2, 4.4, 4.6, 4.8, 5.]))[source]
Compute tabulated percentiles of the CDF for a (lossy) compressed version of the redshift PDF.
The
pdfvalues from thefittable are interpolated onto a fine (dz/(1+z) = 0.0001) redshift grid before the fullcdfis calculated and interpolated.The following shows an example including how to reconstruct the PDF
import numpy as np
import matplotlib.pyplot as plt
from scipy.stats import norm

from grizli import utils
from grizli.fitting import compute_cdf_percentiles, CDF_SIGMAS

# logarithmic redshift grid, but doesn't matter
zgrid = utils.log_zgrid([0.01, 3.4], 0.001)

# Fake PDF from some Gaussians
peaks = [[1, 0.1], [1.5, 0.4]]
pdf = np.zeros_like(zgrid)
for p in peaks:
    pdf += norm.pdf(zgrid, loc=p[0], scale=p[1])/len(peaks)

# Put it in a table
fit = utils.GTable()
fit['zgrid'], fit['pdf'] = zgrid, pdf

cdf_x, cdf_y = compute_cdf_percentiles(fit, cdf_sigmas=CDF_SIGMAS)

# PDF is derivative of CDF
pdf_y = np.gradient(cdf_y)/np.gradient(cdf_x)

fig, ax = plt.subplots(1,1,figsize=(6,4))
ax.plot(zgrid, pdf, label='input PDF')
ax.step(cdf_x, pdf_y, label='compressed from CDF', where='mid', color='0.5')
ax.grid()
ax.legend()
ax.set_xlabel('z')
ax.set_ylabel('p(z)')
(
Source code,png,hires.png,pdf)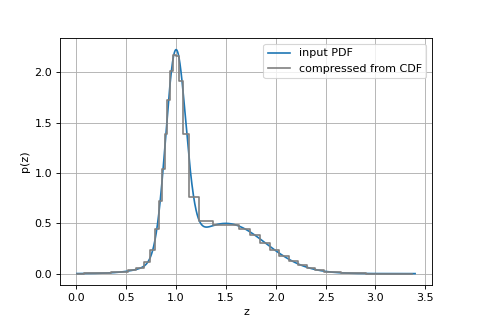
- Parameters
- fit
Table Table that contains, at a minimum, columns of
zgridandpdf, e.g., as output fromgrizli.fitting.GroupFitter.xfit_redshift- cdf_sigmasarray-like
Places to evaluate the CDF, in terms of “sigma” of a Normal (Gaussian) distribution, i.e.,
>>> import scipy.stats
>>> cdf_y = scipy.stats.norm.cdf(cdf_sigmas)
- fit
- Returns
- cdf_xarray-like, size of
cdf_sigmas Redshifts where the CDF values correspond to the values
cdf_yfromcdf_sigmasof a Normal distribution.- cdf_yarray-like
CDF values at
cdf_sigmas
- cdf_xarray-like, size of