flag_nircam_hot_pixels
- grizli.jwst_utils.flag_nircam_hot_pixels(data='jw01837039001_02201_00001_nrcblong_rate.fits', err_extension='ERR', hot_threshold=7, max_filter_size=3, hot_filter_sn_max=5, plus_sn_min=4, corner_sn_max=3, jwst_dq_flags=['DO_NOT_USE', 'OTHER_BAD_PIXEL', 'UNRELIABLE_SLOPE', 'UNRELIABLE_BIAS', 'NO_SAT_CHECK', 'NO_GAIN_VALUE', 'HOT', 'WARM', 'DEAD', 'RC', 'LOW_QE'], verbose=True, **kwargs)[source]
Flag isolated hot pixels and “plusses” around known bad pixels
- Parameters
- datastr,
HDUList NIRCam image filename or open HDU
- hot_thresholdfloat
S/N threshold for central hot pixel
- max_filter_sizeint
Size of the local maximum filter where the central pixel is zeroed out
- hot_filter_sn_maxfloat
Maximum allowed S/N of the local maximum excluding the central pixel
- plus_sn_minfloat
Minimum S/N of the pixels in a “plus” around known bad pixels
- corner_sn_maxfloat
Maximum S/N of the corners around known bad pixels
- jwst_dq_flagslist
List of JWST flag names
- verbosebool
Messaging
- datastr,
- Returns
- snarray-like
S/N array derived from
file- dqarray-like, int
Flagged pixels where
hot = HOTandplus = WARM- countint
Number of flagged pixels
Examples
import numpy as np
import matplotlib.pyplot as plt
import astropy.io.fits as pyfits

from grizli.jwst_utils import flag_nircam_hot_pixels

signal = np.zeros((48,48), dtype=np.float32)

# hot
signal[16,16] = 10

# plus
for off in [-1,1]:
    signal[32+off, 32] = 10
    signal[32, 32+off] = 7

err = np.ones_like(signal)
np.random.seed(1)
noise = np.random.normal(size=signal.shape)*err

dq = np.zeros(signal.shape, dtype=int)
dq[32,32] = 2048 # HOT

header = pyfits.Header()
header['MDRIZSKY'] = 0.

hdul = pyfits.HDUList([
    pyfits.ImageHDU(data=signal+noise, name='SCI', header=header),
    pyfits.ImageHDU(data=err, name='ERR'),
    pyfits.ImageHDU(data=dq, name='DQ'),
])

sn, dq_flag, count = flag_nircam_hot_pixels(hdul)

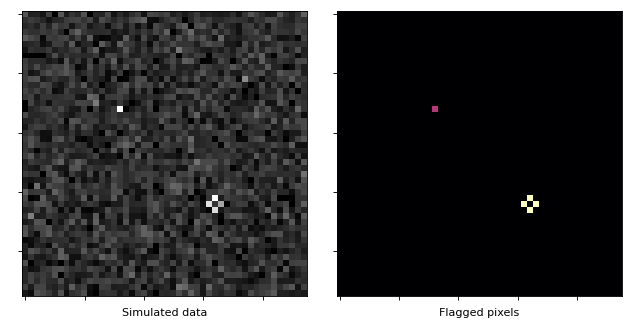
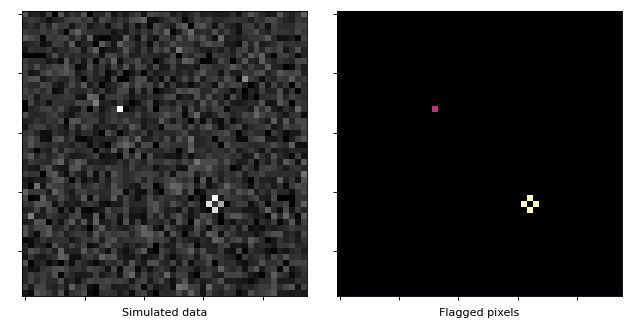
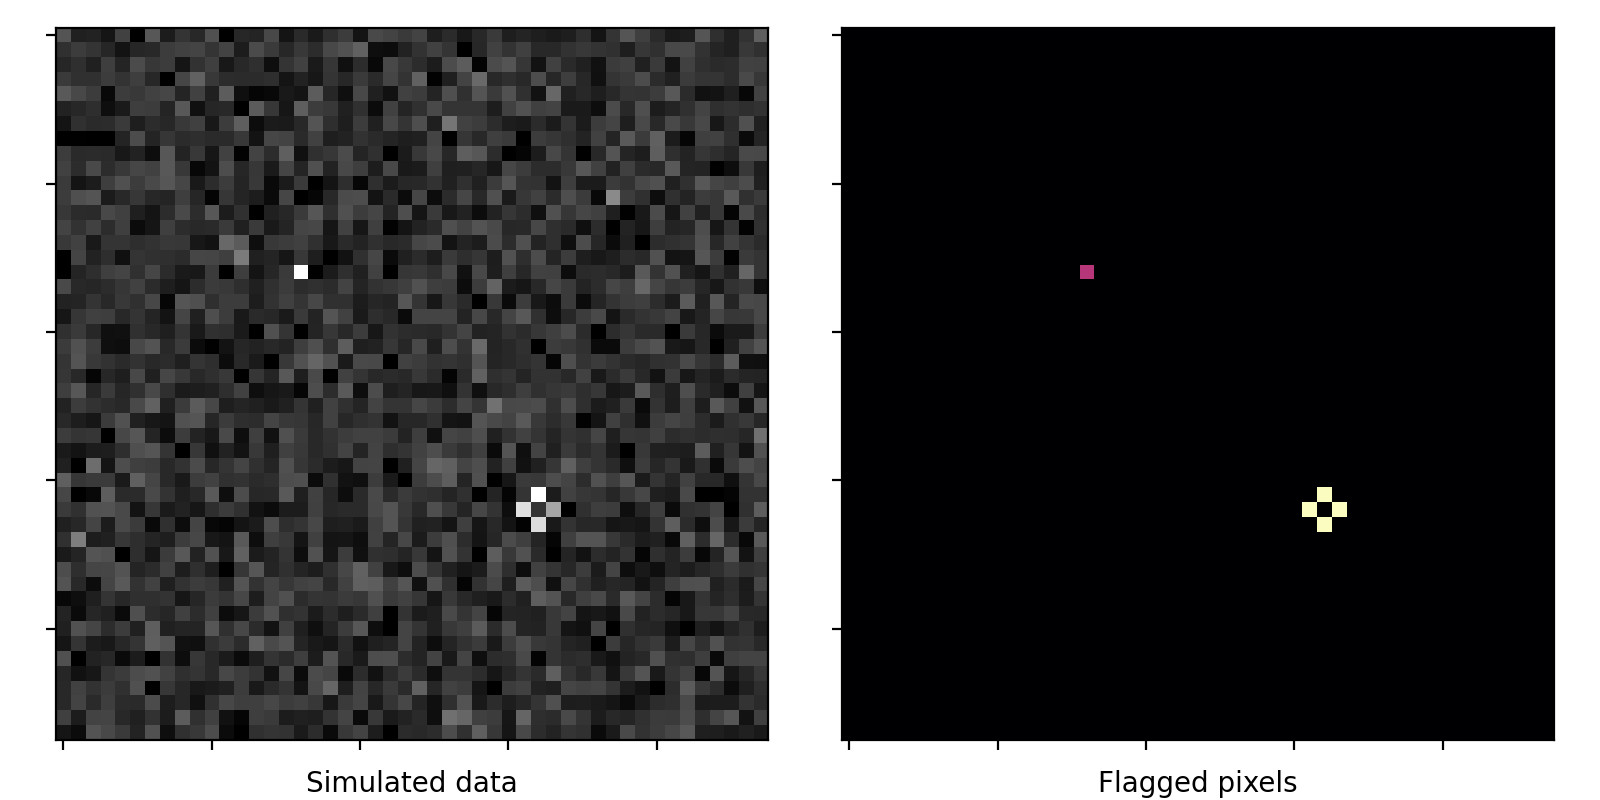
fig, axes = plt.subplots(1,2,figsize=(8,4), sharex=True, sharey=True)

axes[0].imshow(signal + noise, vmin=-2, vmax=9, cmap='gray')
axes[0].set_xlabel('Simulated data')
axes[1].imshow(dq_flag, cmap='magma')
axes[1].set_xlabel('Flagged pixels')

for ax in axes:
    ax.set_xticklabels([])
    ax.set_yticklabels([])

fig.tight_layout(pad=1)

plt.show()
(
Source code,png,hires.png,pdf)